How to Interpret the Fed Dot Plot in 2026: A Practical Guide for Investors
The Federal Reserve's dot plot is a critical tool for investors seeking to anticipate interest rate movements and economic policy shifts. This guide explains what the dot plot shows, how to read it, and how to use it to inform your investment decisions in 2026.
Read more
Semiconductor Cycle Bottom Signals: 5 Indicators Investors Should Watch in 2026
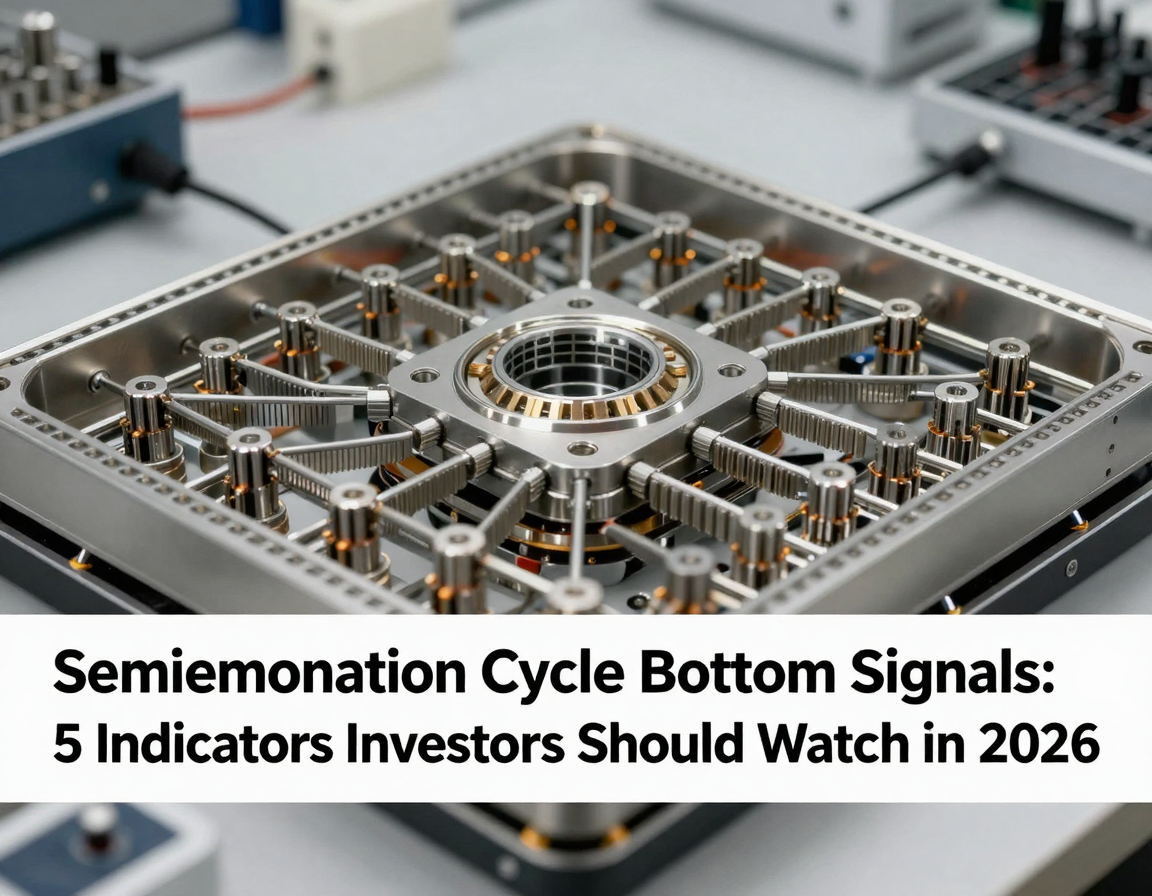
The semiconductor industry is entering 2026 with renewed momentum after volatile post-pandemic cycles. Learn the five key indicators that signal whether the industry has truly bottomed and what investors should monitor.
Read more