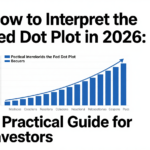
How to Interpret the Fed Dot Plot in 2026: A Practical Guide for Investors
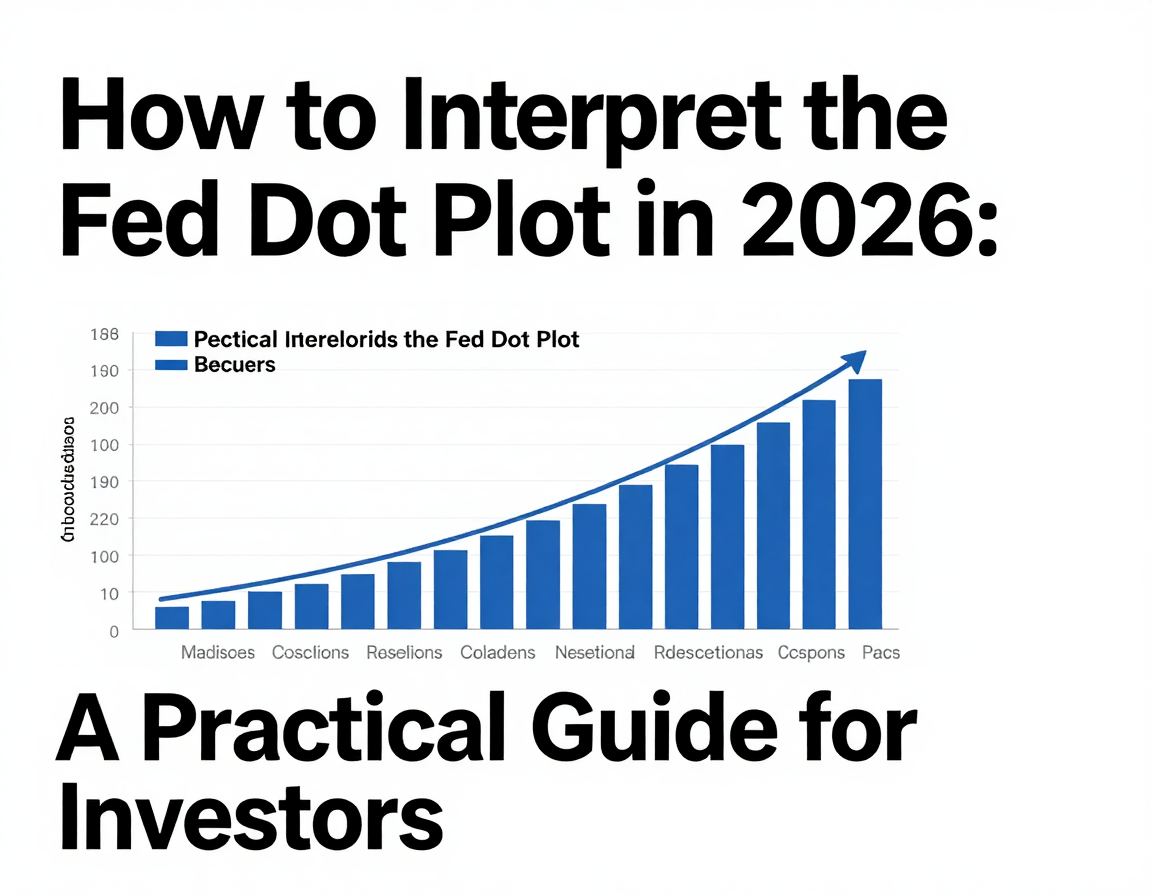
The Federal Reserve's dot plot is a critical tool for investors seeking to anticipate interest rate movements and economic policy shifts. This guide explains what the dot plot shows, how to read it, and how to use it to inform your investment decisions in 2026.
Read more
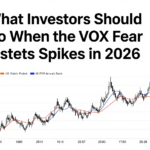
What Investors Should Do When the VIX Fear Index Spikes in 2026
The VIX fear index has shown renewed volatility in early 2026, climbing above the 20-point threshold amid geopolitical tensions and market uncertainty. Discover actionable strategies U.S. investors should implement when volatility spikes.
Read more