The semiconductor industry is poised for robust growth in 2026, with global revenues projected to reach approximately $975 billion, marking over 25% year-on-year expansion driven primarily by AI infrastructure, automotive electrification, and data center demand. While historical cycles featured sharp downturns followed by recoveries, current trends suggest a structural upswing potentially breaking traditional boom-bust patterns, as AI sustains six years of consecutive growth. For U.S. investors eyeing cycle bottom signals amid lingering volatility from prior inventory gluts and geopolitical tensions, monitoring key indicators is crucial to identify the trough and position for the anticipated upcycle to $1 trillion in sales.
1) Inventory Levels Across the Supply Chain
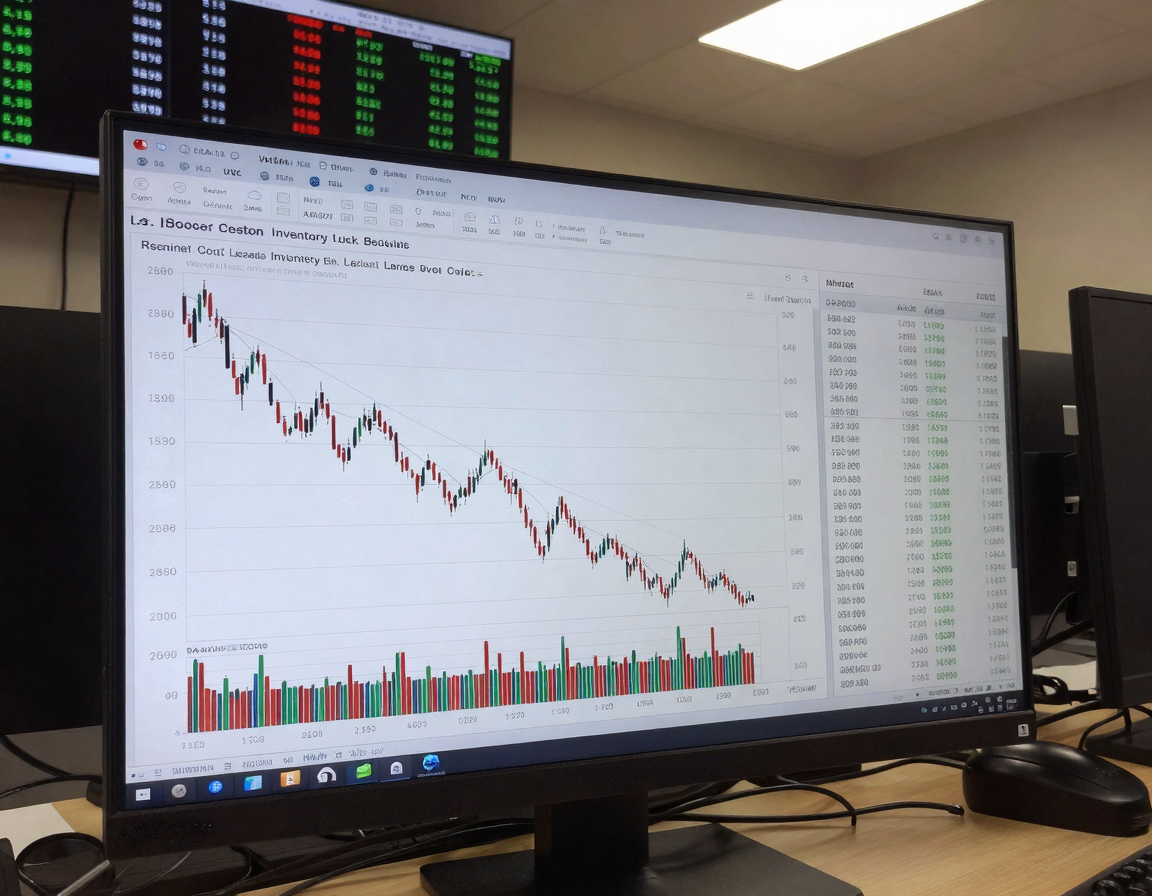
Finished goods inventory has been declining since the last cycle peak and is approaching physical minimums due to transportation constraints, signaling reduced oversupply. Work-in-progress inventory for memory producers remains flat at maintenance levels post-2023 expansion, indicating manufacturing caution rather than aggressive buildup. Deloitte and WSTS data underscore how excess stock from early 2020s volatility is clearing, with AI-driven segments like logic and memory poised for 30%+ growth once bottoms form. U.S. investors should track quarterly reports from firms like TSMC and Intel for inventory-to-sales ratios dropping below 1.2 months, a historical bottom marker.
2) Capacity Utilization Rates

Wafer capacity expansion is diversifying beyond logic and memory into discrete, analog, and microcomponents, supporting comprehensive recovery. Leading foundries report utilization rebounding from sub-70% troughs in mature nodes toward 85%+ in advanced processes, constrained by packaging bottlenecks like CoWoS. PwC forecasts capex and IDM output hitting new peaks in 2026, with 37.6% growth in select segments. Watch U.S.-listed names like NVIDIA and AMD for fab partner updates; rates above 80% signal demand outpacing supply, confirming cycle inflection.
3) Pricing Recovery in Memory and Logic
Commodity memory and mature-node markets (12-28nm) show volatile but stabilizing prices, with lower energy per wafer enhancing relevance amid sustainability pushes. AI chip revenues, exceeding $125 billion in 2024 and likely $150 billion in 2025, distort pricing upward in high-bandwidth memory and advanced logic. Component Sense notes lead times remaining long due to constrained advanced capacity, pressuring prices higher as demand from data centers and EVs accelerates at 10%+ CAGR. Investors should monitor spot prices via indices like DRAMeXchange; sustained 10-15% quarterly hikes indicate bottom formation.
4) Order Backlog and Lead Times
Supply dynamics reveal reduced flexibility, with capacity decisions locking in persistent shortages in AI logic and packaging. Automotive demand for custom silicon in zonal architectures extends lead times to 6-12 months, outpacing vehicle production growth.
Custom accelerators from hyperscalers amplify backlog in advanced nodes, per Omdia trends. For U.S. portfolios, track bookings growth in earnings from Qualcomm and Broadcom; backlogs exceeding 9 months historically precede upcycles.
5) End-Market Demand Signals
Diversified demand from data centers (double-digit growth), automotive (10%+ CAGR), and industrial automation breaks single-market reliance. Data processing segments surpass 50% of revenues in 2026, fueled by AI data centers and EV penetration. HCLTech highlights on-shoring incentives adding 0.7% growth in North America. U.S. investors can gauge via PMI surveys and hyperscaler capex; synchronized upticks across sectors confirm broad-based bottom.
6) Geopolitical and Capex Alignment
U.S. on-shoring via CHIPS Act bolsters resilience, countering China embargoes that wobble supply chains.
Capex peaks align with heterogeneous integration and chiplet commercialization, per forecasts. SIA projects $1 trillion sales, driven by AI, IoT, and autonomous tech. Monitor policy updates and capex guidance from U.S. firms like Intel; aligned increases signal sustained recovery.
How to Apply This in Practice
Practical Checklist for U.S. Investors:
- Screen weekly inventory data from SIA and WSTS for declines below cycle averages.
- Compare foundry utilization reports quarterly against 80% threshold.
- Track memory pricing indices for 10%+ sequential recovery.
- Review top-10 semi firm earnings for backlog extensions over 9 months.
- Monitor end-market PMIs (auto, data centers) for parallel expansions.
- Assess capex announcements versus geopolitical headlines for U.S. alignment.
- Set alerts on AI chip revenue trackers from Deloitte for $150B+ confirmation.
Integrate into portfolios via ETFs like SMH or direct positions in NVDA, TSM ADRs upon 3+ indicators flashing green.
Risk Note
Despite bullish projections, risks persist: geopolitical escalations could prolong China-related disruptions; packaging constraints may cap growth; climate vulnerabilities like water shortages threaten fabs; and AI hype moderation could unevenly hit segments. Historical cycles show forecasting errors amplify surpluses; diversify and use stop-losses. This analysis relies on 2026 forecasts, subject to economic shifts.