Foundry utilization trends in 2026 point to a polarized landscape: advanced semiconductor nodes at full capacity due to AI demand, tightening 8-inch wafer supply, and steady growth in metal casting driven by EVs, aerospace, and infrastructure, offering clear timing signals for U.S. investors.
1)
The global foundries market, encompassing both semiconductor and metal casting sectors, is poised for significant expansion in 2026. Semiconductor foundry revenue is set to grow robustly, fueled by AI, with advanced nodes like 5nm and below fully loaded through year-end. Metal foundries project steady growth to $224.81 billion by 2030 at 4.3% CAGR, anchored in aluminum, copper, and magnesium castings for automotive and construction.
Utilization rates vary sharply: semiconductor advanced nodes operate at 100% capacity, 8-inch wafers tighten amid AI power IC demand, while 12-inch mature nodes lag due to weak consumer electronics. In metal casting, capacity utilization stands at 40-70% despite 15% production gains, signaling room for ramp-up.
2)
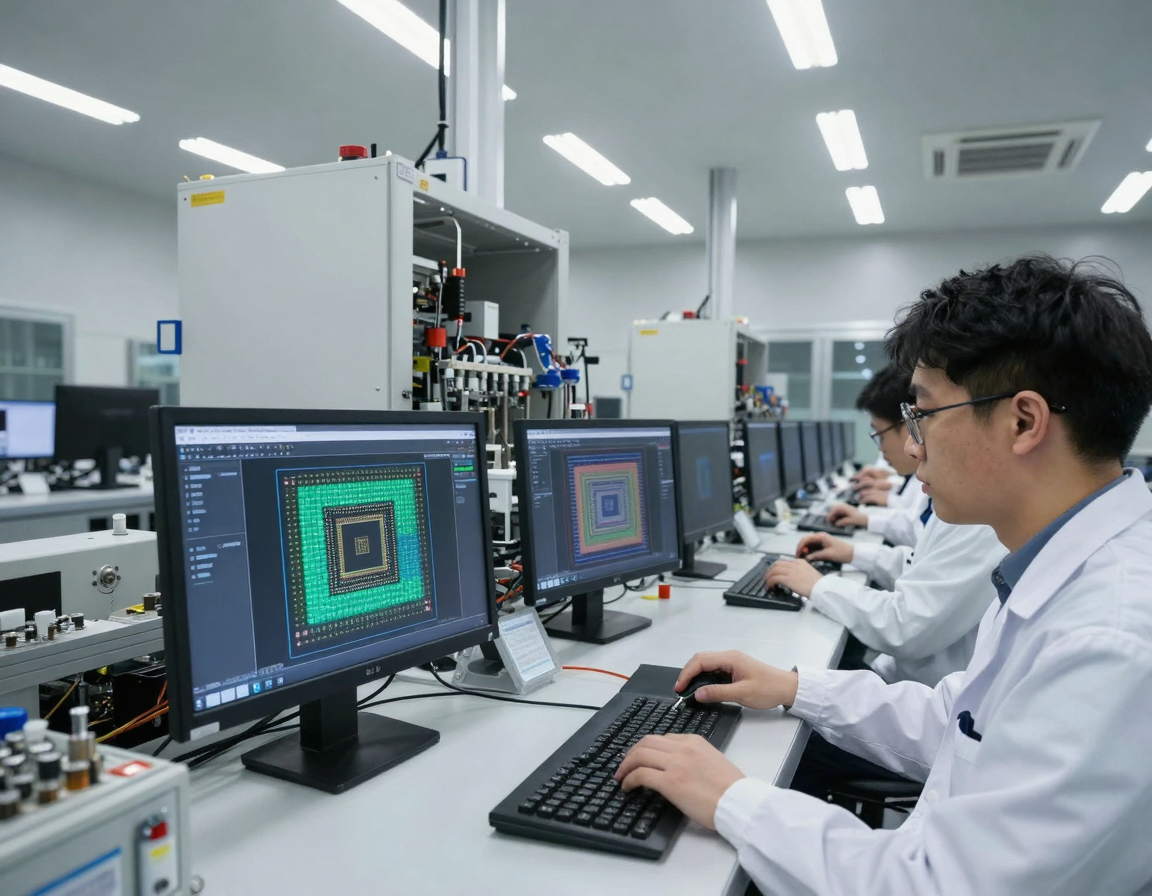
AI demand dominates 2026 semiconductor foundry trends, driving price hikes and full utilization in advanced nodes. TSMC maintains full load on 5/4nm and below until end-2026, while Samsung expands orders. The semiconductor foundry market grows from $185 billion in 2026 to $360.5 billion by 2036 at 6.9% CAGR.
Capacity shifts include strategic cuts in 8-inch production by majors, tightening supply as AI power ICs rise, contrasting weak 12-inch mature nodes (≥28nm) from soft consumer markets. This polarization creates investment signals: overweight advanced node leaders now, monitor mature node recovery.
3)
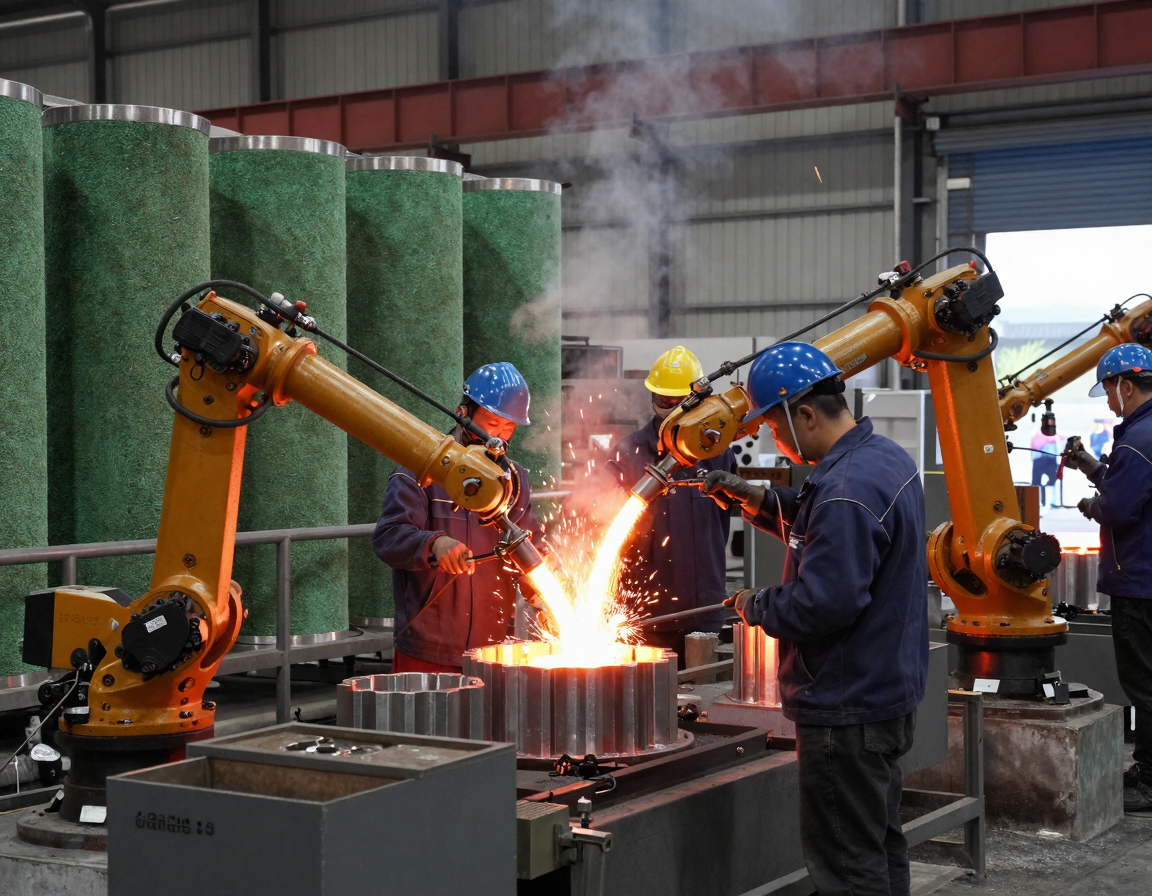
Metal foundry utilization benefits from EV lightweighting and aerospace demand. Aluminum and magnesium castings surge for thin-walled EV components like e-axle housings and structural parts, with high-pressure die casting (HPDC) giga-presses enabling large body structures.
Nonferrous foundries expand, driven by automotive evolution requiring advanced mold coatings to cut defects by 30%. Aerospace grows fastest at 7.1% CAGR for flux systems in high-strength parts. Overall foundry market hits $222.6 billion in 2025, reaching $351.4 billion by 2034 at 5.2% CAGR.
4)
Sustainability reshapes foundry chemicals and operations, with low-VOC, formaldehyde-free alternatives replacing phenolic resins under EU REACH and BAT rules. By 2036, circular models recycle 95% of sand using thermoplastic silicones and water-based coatings, cutting energy in curing.
AI-powered molecular modeling accelerates eco-friendly chemical R&D, shortening cycles from years to months. Metallurgy returns as profit driver via scrap usage, alloy flexibility, and property optimization, no longer optional for competitiveness.
5)
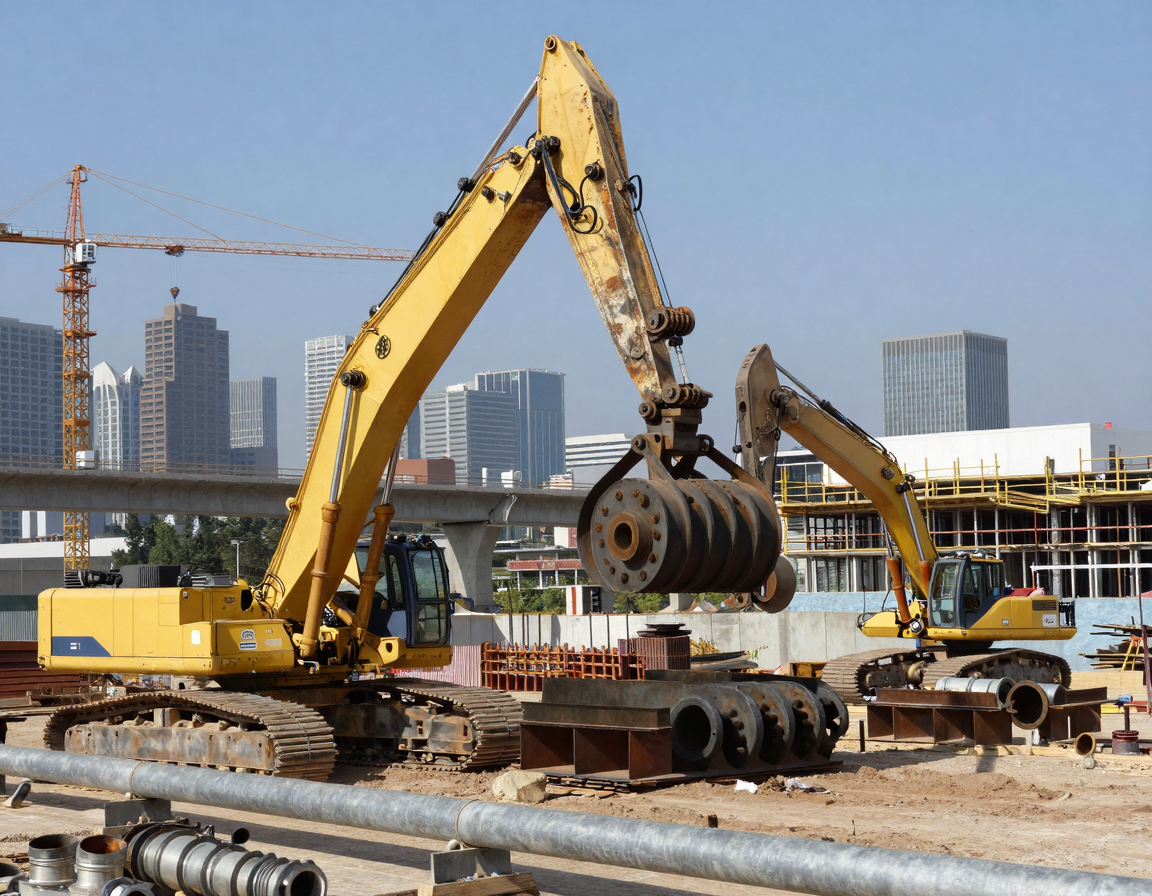
U.S. foundries gain from re-shoring, infrastructure, and EV platforms, investing in large-tonnage HPDC presses and induction furnaces to offset labor gaps. Construction drives ferrous demand for pipes, fittings, structural steel in buildings and bridges.
Mexico’s supplier parks support near-plant casting, while U.S./Canada focus on energy and agriculture equipment with PPAP, CT testing, and EPDs. Ferrous adoption rises alongside nonferrous expansion for high-strength, cost-effective castings in machine tools and electrical gear.
6)
Sector timing signals for 2026: Enter advanced semiconductor foundries now amid full utilization and price hikes; accumulate metal casters on infrastructure/EV dips as capacity utilization (40-70%) offers upside.
Watch AI boom for semis, EV mix shifts for aluminum, and construction recovery for steel. Digitalization via AI defect prediction and closed-loop controls boosts yields, favoring integrated players. Foundry market grows to $306.3 billion in 2025, $429.5 billion by 2032.
How to Apply This in Practice
Practical Checklist for U.S. Investors:
1. **Assess Utilization Metrics:** Track advanced node rates (target >90%) via TSMC/Samsung reports; buy on confirmed full loads.
2. **Monitor AI and EV Drivers:** Allocate 40% to semis/AI leaders, 30% aluminum/EV casters; use ETF proxies like SMH or XLI.
3. **Evaluate Capacity Expansion:** Favor firms with HPDC giga-presses and sand reclamation; check Q1 2026 earnings for capex.
4. **Diversify by Metal Type:** 20% ferrous for infrastructure, 10% chemicals for sustainability plays like BASF/Elkem.
5. **Timing Entry:** Buy semis on pullbacks, metals post-construction data; set stops at 15% below 50-day MA.
6. **Review Quarterly:** Rebalance on utilization shifts, AI order books, EV sales; aim 12-18 month horizon to 2027.
Risk Note
Foundry investments face risks including energy price volatility accelerating melt shop costs, geopolitical tensions disrupting supply chains, soft consumer electronics delaying mature node recovery, regulatory shifts in green chemicals, and skilled labor shortages despite automation. Utilization below 70% signals demand weakness; diversify and monitor macro indicators like U.S. infrastructure spending and AI capex forecasts.