The global semiconductor industry is poised for historic growth in 2026, with sales projected to reach approximately $1 trillion, up from $791.7 billion in 2025, driven primarily by AI infrastructure demand alongside recovering cyclical segments. For U.S. investors, identifying cycle bottom signals is crucial as the sector transitions from early 2020s volatility to a multi-pillar upcycle, marked by diversified demand and disciplined supply growth. This article outlines five key indicators to watch, grounded in recent industry data.
1) Declining Inventory Levels
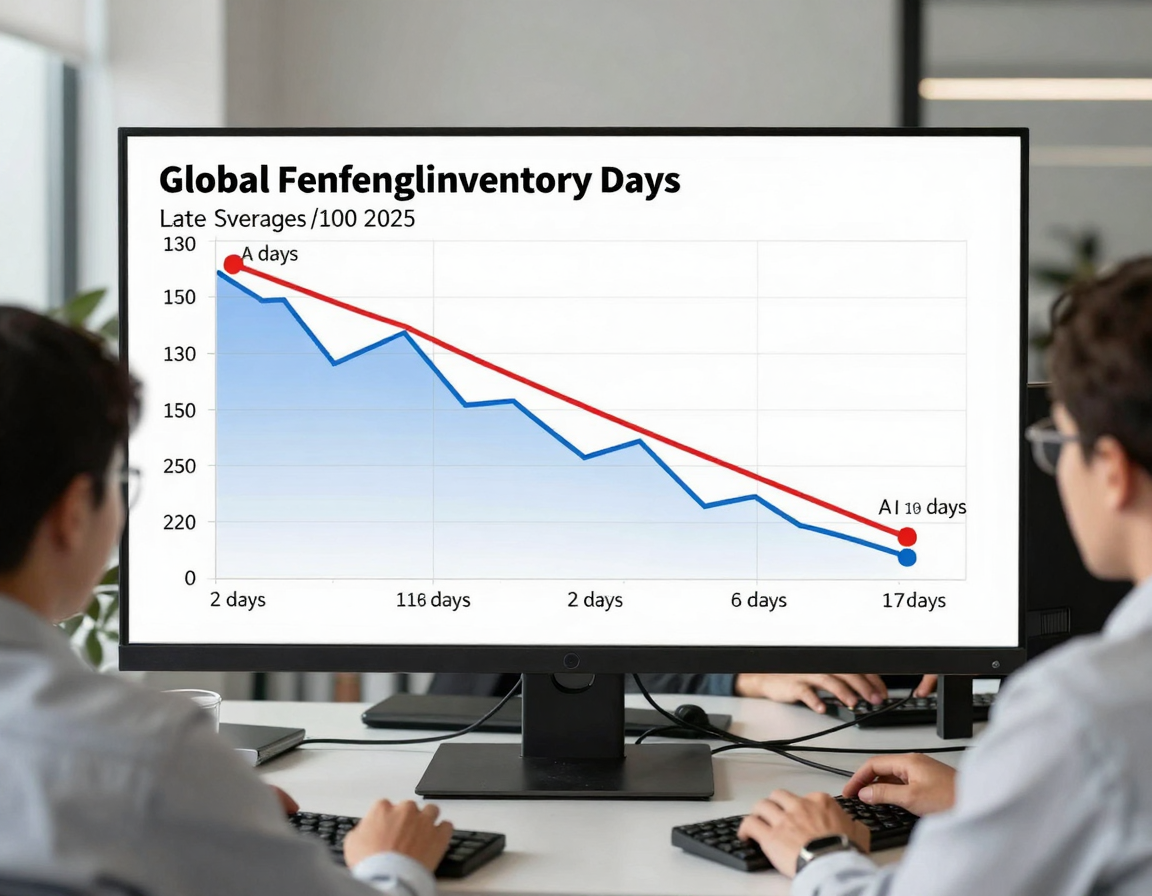
Inventory on semiconductor balance sheets stood at around 130 days at the end of 2025, slightly above the five-year average of 118 days, largely due to AI-related ramps and complex supply chains. A drop toward or below this average signals cycle bottoms, as broad-based de-risking by non-AI companies reduces excess stock and supports manufacturing utilization recovery. Investors should track quarterly reports from major firms like those aggregated by the Semiconductor Industry Association (SIA), where normalization outside AI segments indicates balanced supply-demand dynamics.
2) Foundry Capacity Utilization and Leading-Edge Constraints
Leading-edge wafer capacity, particularly at TSMC’s advanced nodes like 2nm, remains a chokepoint, gating AI accelerator and custom silicon production. High utilization rates above 90% extending into 2026, coupled with long lead times, extend pricing power and cycle strength rather than signaling an imminent downturn. Watch TSMC’s quarterly updates for capacity expansion announcements; delays or constraints affirm upcycle persistence, while sudden overcapacity could flag bottoms.
3) Sequential Revenue Growth Above Historical Averages
The industry achieved +15.8% quarter-over-quarter growth by 3Q25, surpassing the 10-year average of +8.1%, confirming cycle breadth beyond AI. Sustained growth above this benchmark into 2026, with total revenues hitting $975 billion to $1 trillion per WSTS and SIA forecasts, points away from bottoms. U.S. investors can monitor World Semiconductor Trade Statistics (WSTS) monthly releases for regional breakdowns, where consistent positivity across Americas, Europe, and Asia underscores resilience.
4) Diversification Across End Markets

Unlike past cycles reliant on single markets like PCs or smartphones, 2026 demand spans data centers, automotive electrification, industrial automation, and AI devices simultaneously. Automotive shifts to zonal computing boost demand for sensors and high-performance chips, while custom silicon for cloud providers adds complexity without derailing growth. Metrics showing parallel expansion in these pillars, per PwC and Gartner consensus, signal reduced cyclicality and distance from troughs.
5) ASP and Unit Sales Momentum
In 2025, units sold (ex-discretes) rose +11% year-over-year, with average selling prices (ASPs) up ~10%, propelled by memory and AI chips, contributing to +21% total revenue growth. Continued ASP stability or uplift into 2026, alongside unit growth, reflects pricing power from supply constraints and confirms upcycle health. Track SIA’s monthly sales data for ASP trends; erosion here could herald bottoms, but current trajectories suggest extension.
How to Apply This in Practice
- Monitor Monthly SIA/WSTS Reports: Check global and regional sales, focusing on sequential growth exceeding 8-10% averages.
- Track Company Earnings: Review inventory days, fab utilization from leaders like TSMC, Intel, and Nvidia quarterly calls.
- Use Inventory Dashboards: Platforms aggregating balance sheet data for days-of-inventory trends toward 118-day norms.
- End-Market Proxies: Follow AI capex from hyperscalers, EV production ramps, and industrial automation indices for demand breadth.
- Set Alerts for Thresholds: Flag inventory <120 days, utilization >90%, and diversified growth as buy signals for cycle positioning.
Implement this checklist weekly via financial terminals or free SIA newsletters to time entries into semiconductor ETFs or stocks like SMH or individual names ahead of confirmed upswings.
Risk Note
While indicators point to sustained growth, risks include faster-than-expected AI spending deceleration, premature supply catch-up, geopolitical tariffs disrupting China-related chains, or macro downturns amplifying cyclical exposure. Forecasts assume no major recessions; actual outcomes may vary, and past cycles show imbalances can persist. U.S. investors should diversify and consult advisors, as projections like $1T sales carry uncertainty.