
U.S. natural gas prices in 2026 are projected to average between $3.60 and $4.30 per MMBtu at Henry Hub, driven by weather-induced volatility, production increases, and regional supply constraints, significantly influencing power utilities and chemical company stocks.[2][3][4]
1)
January 2026 saw extreme natural gas price volatility, with Henry Hub surging 170% from $3.04 to $8.21/MMBtu in one week due to an arctic blast, thin liquidity, and regional dislocations at hubs like Northern Ventura and Algonquin Citygate.[1]
These spikes, far exceeding winter averages—such as Ventura reaching $41.76 versus a $2.83 average—highlight how cold weather amplifies delivery constraints, persisting into March regardless of short-term relief.[1]
While Waha Hub in the Permian Basin stayed negative at -$2.94 to -$3.15, other areas like Houston Ship Channel gained 71%, underscoring uneven national impacts.[1]
2)
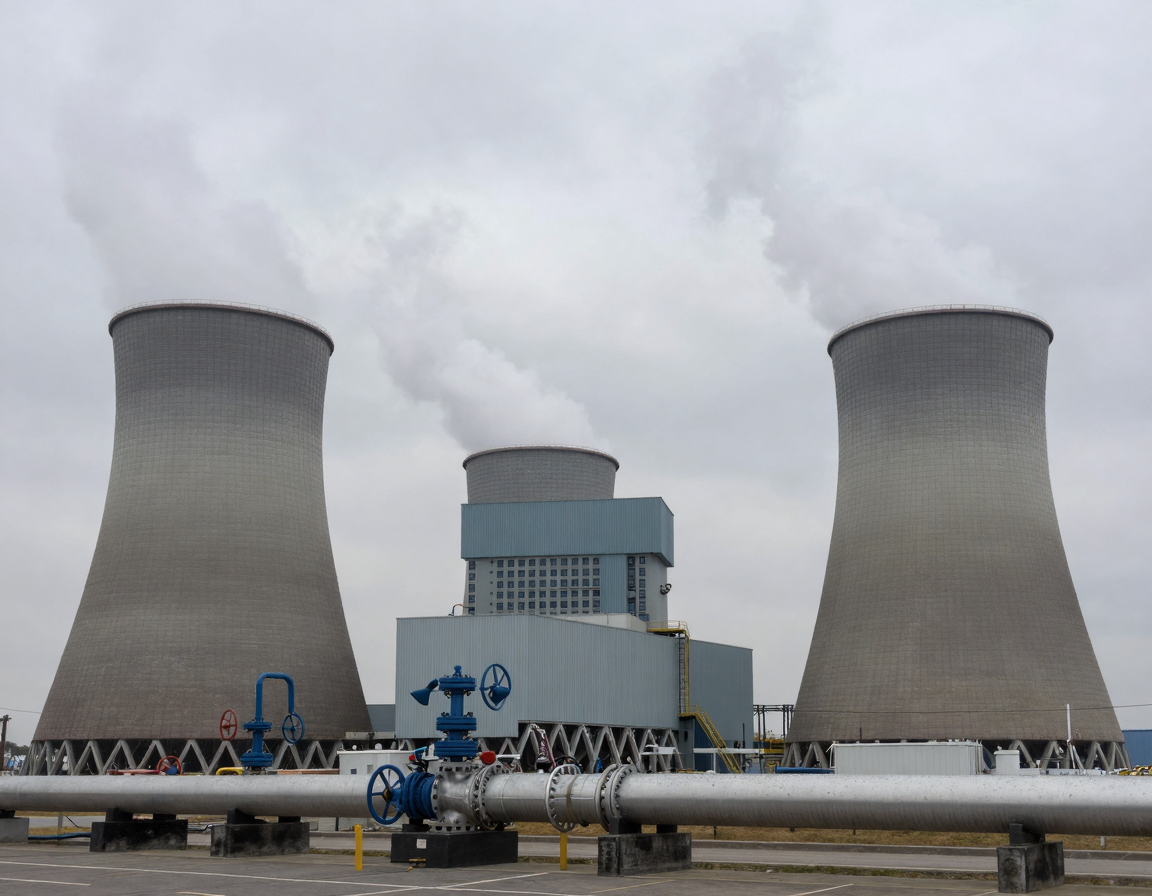
Power utilities rely heavily on natural gas for electricity generation, making them vulnerable to price swings; EIA forecasts Henry Hub at $4.30/MMBtu in 2026, down slightly from prior estimates due to higher production offsetting winter demand.[2]
Cold snaps like December 2025 and January 2026 boosted Q1 2026 spot prices to $4.35/MMBtu, increasing heating demand by 6% and drawing down storage 28% above five-year averages, pressuring utility costs.[3]
Enverus projects winter averages at $3.80/MMBtu dropping to $3.60 in summer, but volatility from freeze-offs and short-covering could raise input costs, squeezing margins for gas-fired plants.[1][4]
3)
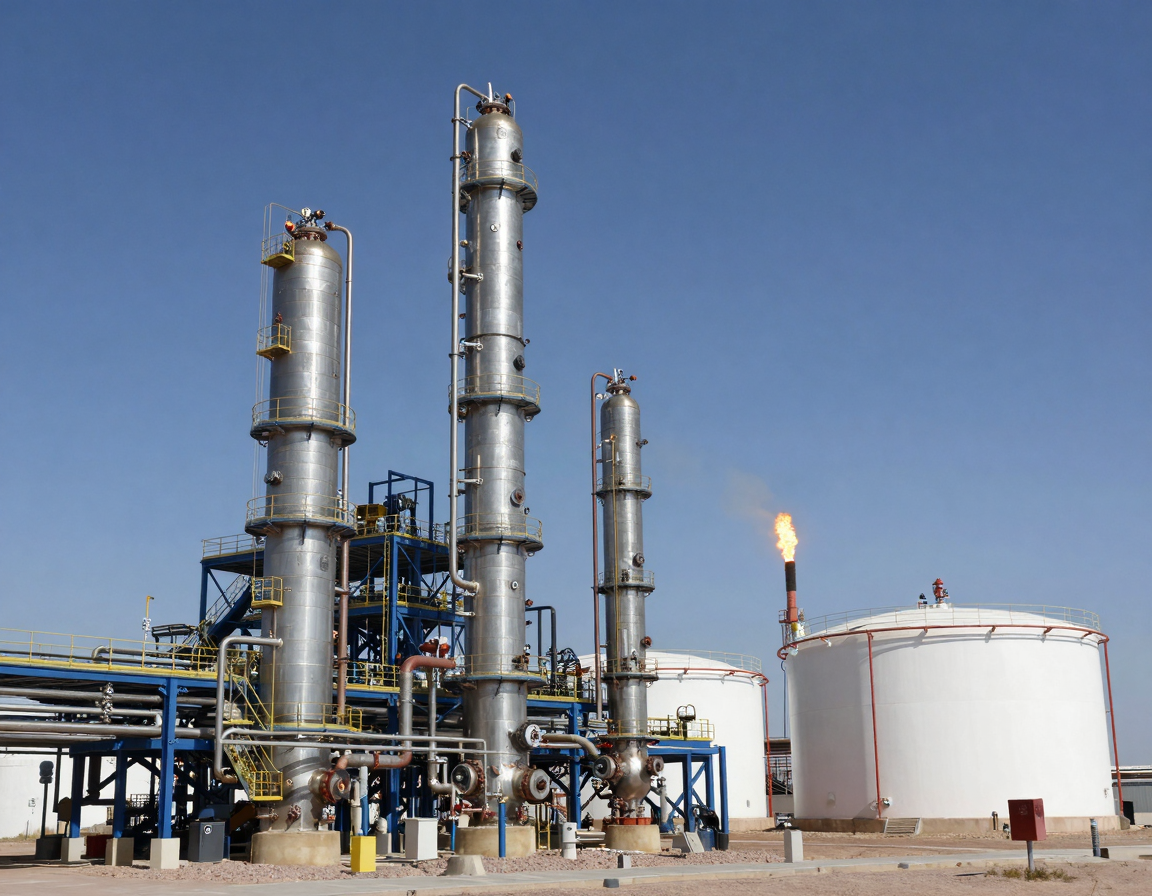
Chemical producers use natural gas as both fuel and feedstock for ammonia, methanol, and fertilizers; volatility directly hits production costs, with January surges potentially eroding profitability if unhedged.[1]
Higher 2026 prices around $4/MMBtu, per EIA and S&P Global, may increase operating expenses by 10-20% for gas-intensive firms, depending on regional hub exposure like Houston Ship Channel’s gains.[1][3]
Persistent Permian negatives offer some relief for Texas-based plants, but national rallies strain margins, especially if global LNG demand keeps U.S. exports firm.[4]
4)
Utilities with diversified fuel mixes or long-term hedges fare better; rising Permian production—up 2% in 2026 to 109.1 Bcf/d—via new pipelines and drilling response to early-year highs will moderate later prices.[2][3]
However, Q4 2025 and Q1 2026 storage ending at 2 Tcf (9% above average) provides a buffer, yet regional extremes like Iroquois Zone 2’s $31 surge signal spot market risks for unhedged power generators.[1][3]
5)
Chemical stocks face amplified effects from feedstock costs; Enverus notes steady European TTF at $10-12/MMBtu supports U.S. LNG, indirectly bolstering domestic supply but tying prices to global balances.[4]
March 2026 prompt-month contracts fell 25.7% in one day to $3.24/MMBtu, showing downside volatility risks that could boost chemical margins temporarily before production ramps.[6]
6)
Investor positioning hinges on forecasts: EIA sees $4.01/MMBtu full-year 2026 average, with production at 119.6 Bcf/d in Q1, favoring utilities with storage access and chemicals hedged against spikes.[3]
Geopolitical oil factors, like Brent at $58/b, indirectly influence via gas-to-oil ratios in Permian, enhancing associated gas output.[2]
How to Apply This in Practice
Practical Checklist for U.S. Investors:
1. Review portfolio exposure: Identify holdings in gas-dependent utilities (e.g., those with >40% gas-fired capacity) and chemicals (e.g., nitrogen fertilizer producers).
2. Check hedging status: Favor companies disclosing 50%+ of 2026 gas needs hedged at $3.50-4.00/MMBtu.
3. Monitor EIA STEO updates: Track Henry Hub forecasts and storage levels weekly.
4. Assess regional risks: Avoid heavy bets on Northeast utilities exposed to Algonquin volatility; prefer Permian-linked chemicals.
5. Diversify fuels: Prioritize utilities blending nuclear/renewables to buffer gas swings.
6. Watch weather models: Use NOAA outlooks for arctic risks amplifying Q1 prices.
7. Evaluate production trends: Track Permian pipeline adds for supply relief by H2 2026.
8. Hedge personally: Consider nat gas ETFs or options for volatility plays.
9. Quarterly earnings focus: Scrutinize fuel cost guidance post-January spikes.
10. Long-term view: Bet on $3.60-4.30 range stabilizing with 2% production growth.
Risk Note
Forecasts carry uncertainty; extreme weather, production freeze-offs, or geopolitical shifts could deviate prices beyond $3-8/MMBtu range, amplifying losses for unhedged stocks. Past volatility like 170% Henry Hub surges does not predict future results; consult advisors and diversify.[1][2]