The S&P 500 closed at 6624.70 on March 18, 2026, with a forward P/E ratio of 19.77x based on estimated 12-month earnings of $335.08. Investors face a pivotal question: can projected earnings growth of 12% in 2026 sustain this valuation, or do elevated multiples signal expansion risks?
1)
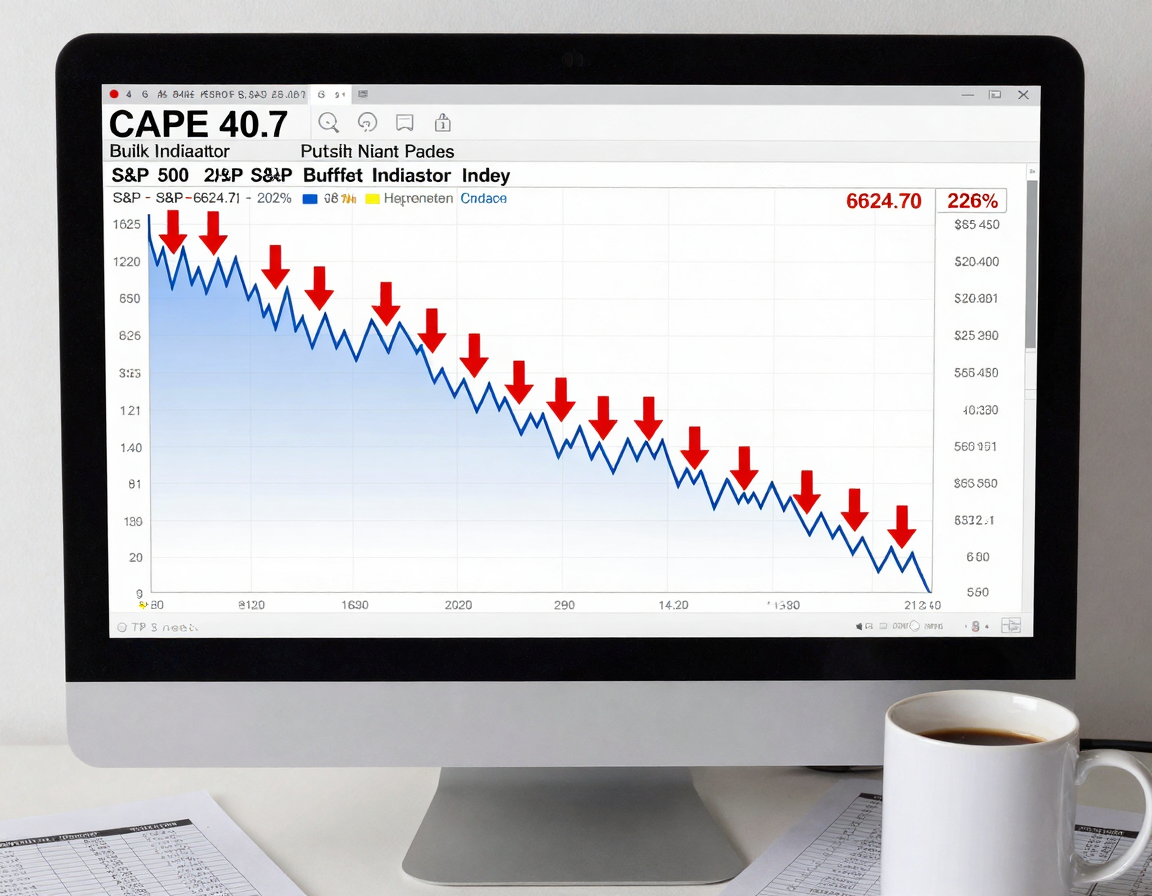
Current S&P 500 valuations reflect a market priced for strong performance, trading at 22.4x forward earnings earlier in the period, a level matching November 2020 peaks. The cyclically adjusted P/E (CAPE) ratio stands at 40.7, historically high and leaving little room for error on earnings or policy shifts. Meanwhile, the Buffett Indicator at 226% exceeds the 200% pre-dot-com crash level, warning of potential flat or negative 10-year returns.
2)
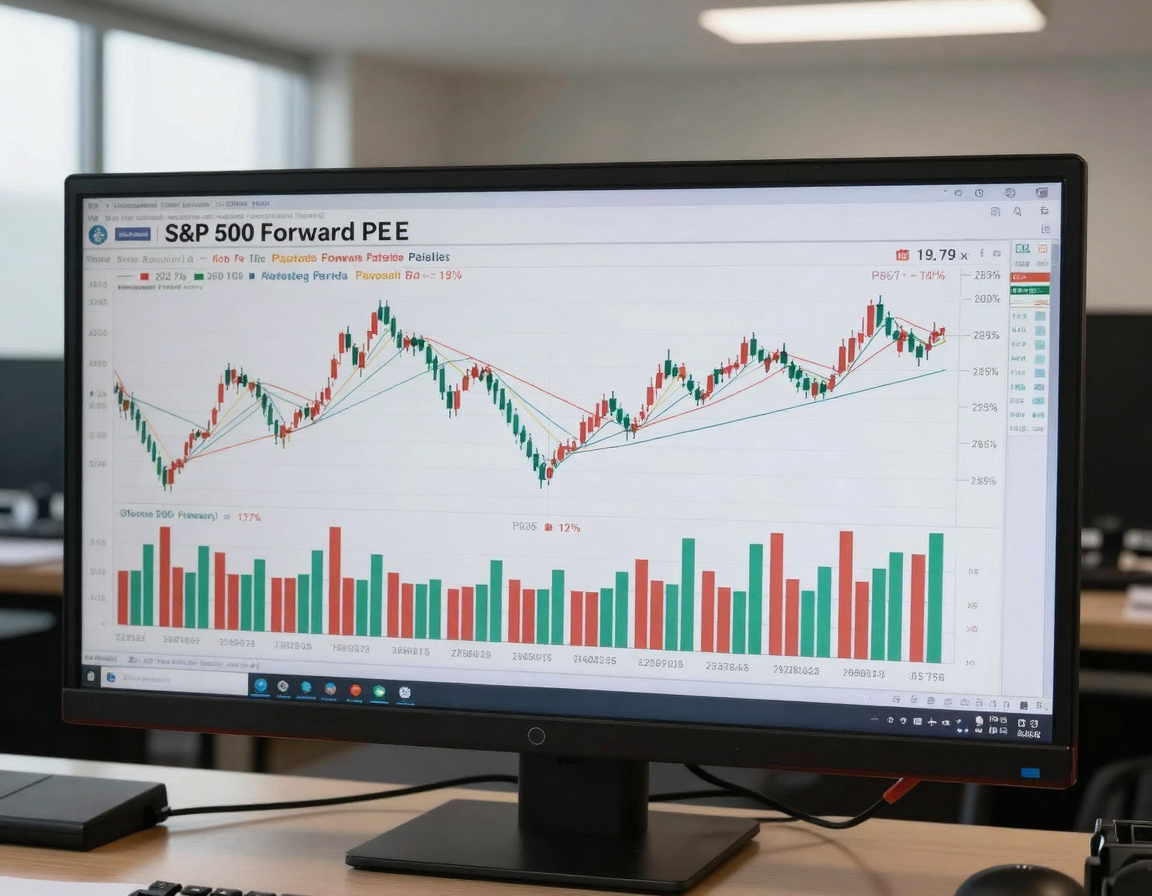
Forward P/E has hovered around 22x, approaching the 2000 record of 24x, driven by AI-fueled rallies but now at 19.77x as of late March 2026. Oppenheimer forecasts S&P 500 EPS at $305 per share for 2026, up from $275 in 2025, implying 11% growth at a 26.5x multiple for a year-end target of 8,100. Goldman Sachs projects 12% EPS growth supporting a 12% total return, with steady long-term rates limiting multiple changes.
3)
Analysts expect corporate earnings to drive gains amid solid GDP growth and Fed easing, with the federal funds rate at 3.50%-3.75% after a December 2025 insurance cut. Consensus sees TMT earnings growth slowing to 18% from over 20% since 2023, while the rest of the index achieves 11%, narrowing the gap from fourfold disparity. This convergence could support valuations if realized.
4)
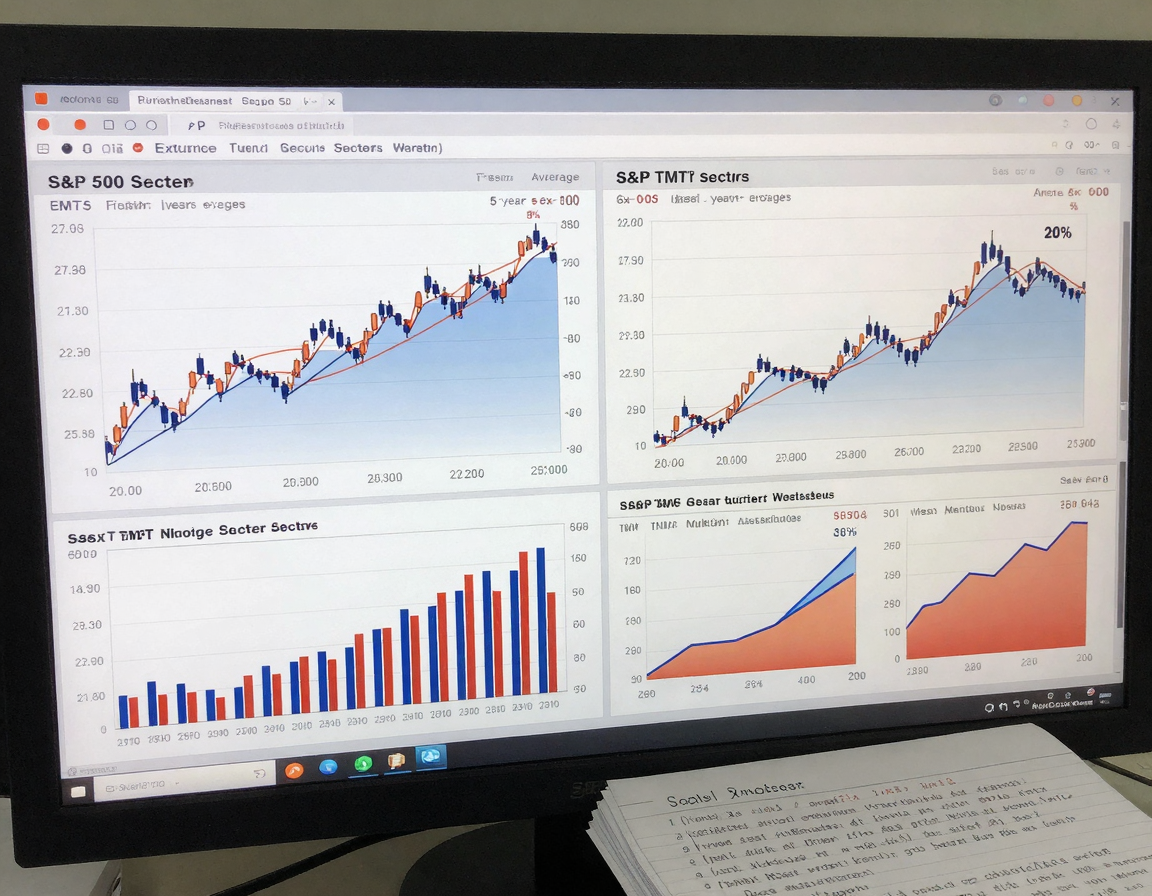
Market concentration amplifies risks, with the Magnificent Seven comprising nearly 40% of the index and TMT multiples at 27.9x versus ex-TMT near 5-year averages. S&P 500 forward P/E surged 40% to 22.4x over the past decade, while equal-weight rose just 6% to 17.0x, signaling unsustainable imbalance. Policy tailwinds like a $285 billion tax cut package fuel optimism, but uneven earnings distribution persists.
5)
Shiller CAPE averages 17.35 over 155 years, yet has traded above this for decades due to low rates and tech adoption. AI productivity gains challenge traditional metrics, with proponents arguing for revaluation akin to the Industrial Revolution. However, high valuations increase downside if earnings disappoint, as noted by strategists.
6)
Two scenarios emerge for 2026: consolidation with 15% earnings growth allowing catch-up, or re-rating from liquidity squeezes or AI hardware saturation. Broader leadership may shift to mid-caps or value stocks, with opportunities in neglected sectors trading at discounts. Elevated multiples heighten volatility from Fed reversals on tariffs or inflation.
How to Apply This in Practice
- Monitor quarterly EPS reports against 12% growth consensus; track TMT versus ex-TMT divergence.
- Compare forward P/E to historical averages (17-22x); watch for contraction below 19x signaling risks.
- Assess concentration: if top 10 stocks exceed 35% weight, diversify into equal-weight or value ETFs.
- Evaluate macro catalysts: Fed funds rate, GDP prints, and tariff impacts on CPI.
- Stress-test portfolio: model 10-15% drawdown from multiple compression using CAPE and Buffett Indicator levels.
- Rebalance toward GARP (growth at reasonable price) in industrials or internationals if S&P 500 P/E exceeds 22x.
Risk Note
Projections assume no major disappointments; high valuations amplify downside from earnings misses, policy shifts like tariff-induced inflation, or AI growth slowdowns, potentially triggering 20%+ corrections as in historical peaks. Past performance does not guarantee future results; consult advisors for personalized strategies.