1. Introduction: Setting the Stage for Post-Midterm Market Navigation
The November 2026 U.S. midterm elections represent a pivotal moment for financial markets, where political uncertainty intersects with underlying economic resilience, compelling investors to adopt a disciplined, forward-looking approach. Historical patterns reveal that midterm election years consistently deliver heightened volatility, with the S&P 500 experiencing average drawdowns of 17.5% to 21% from peak to election-day lows since 1950, only to unleash powerful rebounds averaging 47% from those lows to subsequent highs. This cycle of contraction and expansion stems from the natural amplification of policy risks during election periods, as markets price in potential shifts in congressional control that could alter fiscal trajectories, trade regimes, and regulatory environments.
Since the robust gains of 2024 and 2025—driven by Federal Reserve rate cuts, sustained corporate earnings growth, and technological innovation—markets have demonstrated remarkable adaptability, yet the approach of midterms introduces fresh layers of caution. Prediction markets and polling data currently signal a high likelihood of the president’s party losing ground, particularly in the House, echoing historical precedents where the incumbent party sheds an average of 28 seats. This dynamic often leads to divided government, which, while initially disruptive, historically paves the way for post-election clarity and above-average returns, with 12-month S&P 500 gains averaging 12.4% to 15.4% after midterms.
At the core of this outlook lie seven essential variables that investors must monitor closely: economic growth momentum, fiscal policy evolution including the impacts of the 2025 Omnibus Budget and Border Security Act (OBBBA), Federal Reserve policy calibration, midterm election outcomes, trade policies and tariffs, business investment trends, and federal debt sustainability. S&P 500 price targets for year-end 2026 diverge sharply among strategists, ranging from conservative estimates around 6,200 to optimistic projections near 7,500, reflecting divergent views on how these variables interact amid election fog. The private sector’s AI-driven productivity surge provides a critical buffer, potentially offsetting political headwinds through accelerated capital expenditures and earnings resilience. For investors, the practical implication is clear: maintain liquidity for opportunistic deployments during drawdowns, prioritize sectors with structural tailwinds like technology and energy, and anchor decisions to leading indicators such as quarterly GDP releases, corporate guidance revisions, and policy announcements. By tracking these variables systematically, portfolios can be repositioned to capture the historical post-midterm rebound while mitigating downside risks from volatility spikes, which options markets price as peaking in the weeks leading to November 6.
2. Economic Growth Momentum: Building on Fiscal Support and Cooling Inflation

U.S. economic growth in 2026 is projected to maintain a solid pace around 3.0% real GDP expansion, propelled by a confluence of fiscal tailwinds, technological advancements in artificial intelligence, and a disinflationary environment that enables continued monetary accommodation. This momentum arises causally from the lagged effects of 2025 stimulus measures, which have bolstered consumer and business spending, combined with productivity gains from AI integration across industries, which could lift potential output by 0.5-1.0% annually according to econometric models. Cooling inflation—expected to stabilize near the Federal Reserve’s 2% target—further supports this trajectory by reducing input costs for businesses and preserving household purchasing power, aligning with the favorable third-year dynamics of the presidential cycle where growth typically accelerates post-midterms.
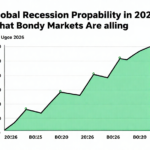
Key drivers include robust consumer spending, which accounts for nearly 70% of GDP and benefits from wage gains outpacing inflation, alongside policy incentives such as tax credits for domestic manufacturing and energy production embedded in recent legislation. The post-2025 stabilization has materially diminished recession probabilities, with leading indicators like the yield curve now steepening positively and corporate balance sheets at record strength. However, investors must vigilantly track first-quarter 2026 GDP data and corporate earnings reports, as any deceleration below 2.5% could trigger a reassessment of growth expectations, amplifying market volatility through higher equity risk premiums and potential sector rotations away from cyclicals.
From a macro strategy perspective, this growth backdrop implies a constructive environment for risk assets, but with nuances: sustained momentum favors broad market exposure, particularly in productivity-sensitive sectors, while early signs of slowdown warrant defensive tilts toward quality dividend payers. Historical presidential cycle analysis underscores that tailwinds from fiscal support and easing cycles enable investors to navigate election turbulence effectively, often turning pre-election dips into buying opportunities with compounded returns exceeding 20% over the subsequent six to twelve months. Practical portfolio implications involve stress-testing allocations against GDP scenarios—base case at 3.0% supporting S&P targets above 7,000, downside risks prompting hedges via options or cash equivalents—and maintaining exposure to AI-enablers like semiconductors and cloud infrastructure, whose capex cycles are less sensitive to political noise.
3. Fiscal Policy and OBBBA: Balancing Stimulus Gains Against Rising Debt Concerns
The 2025 Omnibus Budget and Border Security Act (OBBBA) stands as a cornerstone of fiscal policy, delivering targeted stimulus through retroactive tax cuts, infrastructure outlays, and border-related expenditures, which Congressional Budget Office (CBO) estimates could add 0.6% to 0.9% to 2026 GDP growth via multiplier effects on aggregate demand. These measures causally stimulate early-year consumption through refundable credits and accelerated depreciation schedules, while bipartisan commitments to spending on defense, energy transition, and supply-chain resilience provide sustained support. However, this expansion occurs against a backdrop of rising debt-to-GDP ratios, projected to approach 110% by mid-2026, as bond issuance surges to $800 billion quarterly, pressuring yields and long-term sustainability.
Midterm elections historically disadvantage the president’s party, with average House seat losses of 28 since 1946, and current prediction markets pricing a 60-70% chance of Republican House retention but tighter margins, potentially leading to gridlock on further stimulus. Lame-duck sessions post-election could preemptively address spending priorities, influencing market sentiment through signals on appropriations and reconciliation packages. Tight credit spreads reflect investor confidence in near-term growth, but vigilance is required on debt ceiling negotiations, slated for Q3 2026, where brinkmanship could induce short-term Treasury volatility.
For investors, the causal link between fiscal stimulus and growth necessitates monitoring CBO updates and bipartisan deal-making for sustainability signals: robust OBBBA implementation supports cyclical sectors like industrials and materials, but escalating debt concerns favor duration-hedged fixed income and inflation-protected assets. Practical strategies include scenario planning—base case of moderate spending yielding 10-12% equity upside, versus fiscal restraint prompting rotations to value stocks—and quarterly reviews of Treasury auction results to gauge supply absorption, ensuring portfolios balance stimulus-driven gains against long-term fiscal drag.
4. Federal Reserve Policy: A Supportive Tilt Facing Tariff and Election Headwinds
The Federal Reserve’s policy stance enters 2026 with a supportive bias, building on 2024-2025 rate cuts that have anchored disinflation and fueled market gains, with markets pricing in 50-75 basis points of additional easing contingent on labor market stability. This dovish tilt causally stems from progress toward the 2% inflation goal, allowing the FOMC to prioritize employment amid cooling wage pressures, though pauses or reversals loom if tariffs rekindle price pressures. Mid-2026 FOMC meetings will scrutinize nonfarm payrolls, core PCE inflation, and trade balance data, balancing growth support against election-induced fiscal expansions.
Tariff implementations under review—potentially via IEEPA or Trade Act authorities—pose upside inflation risks of 0.5-1.0%, prompting hawkish adjustments that could cap equity multiples, while stable job growth and earnings necessitate measured accommodation to avoid overheating. Fiscal policy interactions amplify this: OBBBA spending could widen deficits, steepening the yield curve and pressuring policy normalization.
Investor implications hinge on tracking payroll reports and dot plots for forward guidance: a supportive path validates growth-oriented allocations, with 25bps cuts per meeting bolstering tech and consumer discretionary; tariff-driven hikes signal shifts to financials and commodities.